Using data analyics to track progress

I’m working with a 19 year old college student originally from the Chicago area who is currently studying in Belgium. He was very excited for the opportunity to compete in real European bicycle road races this spring. His experience so far in bike racing had been centered in midwest U.S. criteriums and cyclocross events. With his move to longer road races this season the training emphasis would be on fatigue resistance – increasing the length of time he could hold FTP.
We approached fatigue resistance in stages. First, I had him do as much riding in Zone 2 as his schedule allowed. Then we started tempo intervals, progressing up to two hours of continuous Zone 3. Next we worked on increasing time in Zone 4a (or Sweet Spot). Same thing with Zone 4 (FTP). We then added some Max Aerobic (Vo2 max) intervals to help raise the aerobic roof and FTP. The last piece of the training puzzle is to progress into race specific workouts and intervals. These workouts are derived from studying his actual race charts.
Looking at the fitness data from April 16 to May 6th, we see nice progress.
| 4/16/2017 | 5/6/2017 | |
| FTP watts/Kg | 3.76 | 4.02 |
| VO2 max | 2.86 L/min | 3.99 L/min |
| mFTP% VO2 max | 78.30% | 78.80% |
| Time to exhaustion | 53:17:00 | 58:08:00 |
| Anaerobic capacity | 16kj | 19kj |
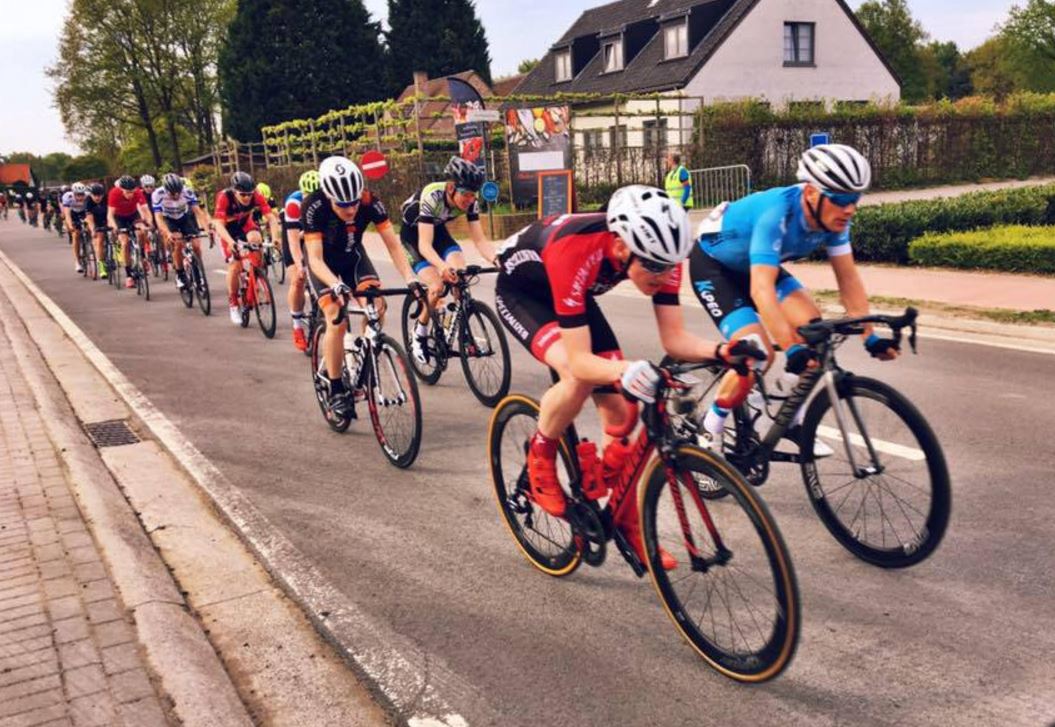
Here is how his fitness data manifest itself in his early season, April 16 race, to his mid/early season race, May 6th.
5/6/2017 – Kermesse Putte
Time above Pmax/FRC: 0:05:00
Time above FRC: 0:15:33
Pmax/FRC Match Count: 300
FRC Match Count: 933
Peak 30 sec power: 478
4/16/2017 – Kermesse Wijgmaal
Time above Pmax/FRC: 0:00:36
Time above FRC: 0:03:45
Pmax/FRC Match Count 36
FRC Match Count 225
Peak 30 sec power: 391
